Unable to change edge router ports

In the docs for rcstack it says to change the ports if they are unavailable. I’ve tried to change them via the docker-compose-router.override.yaml but my settings seem to have been ignored and i end up with this error:

root@monarch5:/opt/docker-rhodecode# ./rcstack stack all up -d
WARN[0000] /opt/docker-rhodecode/docker-compose-base.yaml: `version` is obsolete
WARN[0000] /opt/docker-rhodecode/docker-compose-router.yaml: `version` is obsolete
WARN[0000] /opt/docker-rhodecode/.custom/docker-compose-router.override.yaml: `version` is obsolete
[+] Running 0/1
 ⠼ Container rc_cluster_router-traefik-1  Starting                                                                                                0.5s
Error response from daemon: driver failed programming external connectivity on endpoint rc_cluster_router-traefik-1 (6a3c2edcd944857527148196c47bc5b41c107f18b406ccf969b797ef85b2a7cc): Error starting userland proxy: listen tcp4 0.0.0.0:443: bind: address already in use

I attached my yaml below:

version: '3.9'

## docker network create -d overlay lb-net
services:

  traefik:
    ports:
#      # The Web UI (enabled by --api.insecure=true)
#      # uncomment to expose dashboard at port :7000,
#      # this is mostly for debugging routes and services
#      - "7000:7000"
      - "8072:80"
      - "8073:443"

    volumes:
      # Bind to docker.sock that Traefik can listen to the Docker events
      - /var/run/docker.sock:/var/run/docker.sock

#      # custom traefik config, enable SSL etc...
#      # put your traefik setup in this directory structure, and uncomment to override
#      # default traefik static/dynamic configs
#      - $PWD/.custom/traefik_custom:/etc/traefik:ro
#      - $PWD/.custom/traefik_custom/dynamic:/etc/traefik_dynamic:ro

#       # Mount ACME shared json config for lets-encrypt
#      - $PWD/.custom/traefik_custom/acme:/acme

    environment:
      RC_COMPOSE_OVERRIDE: 1

    labels:
        - "traefik.enable=true"
                                       

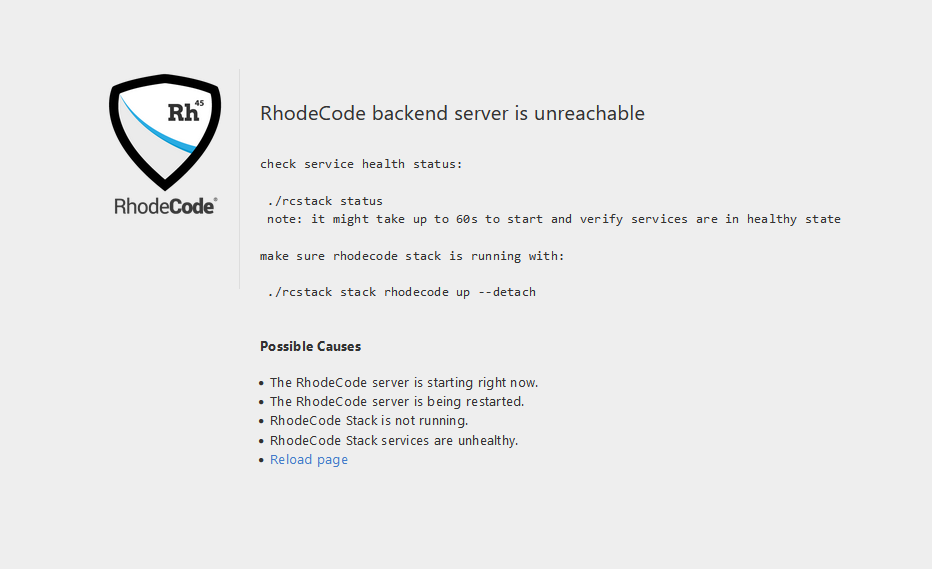
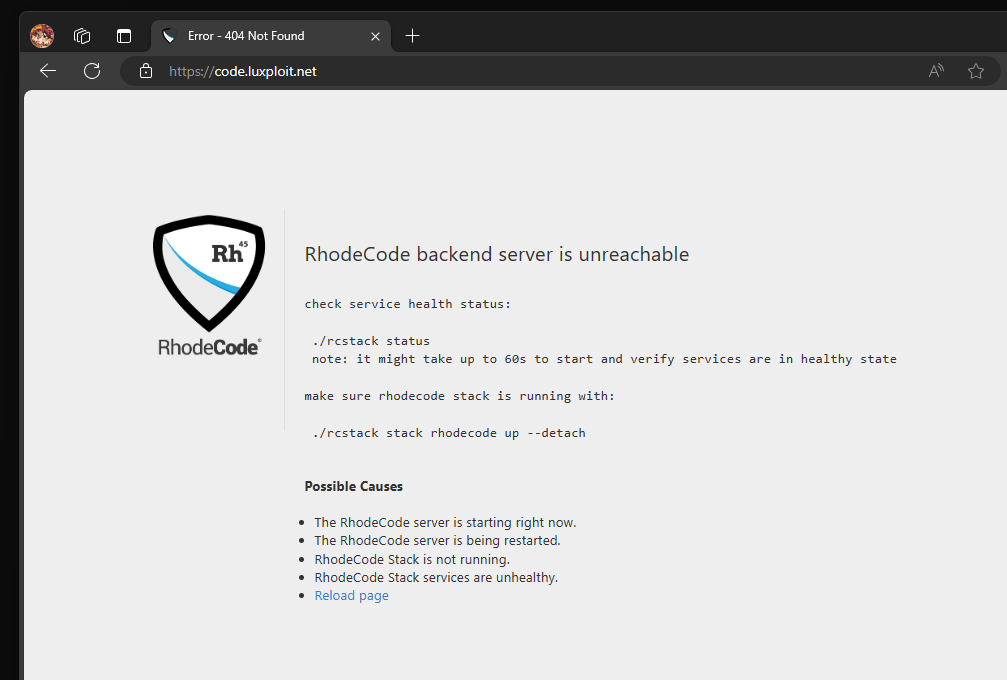
Quick Update: after modifying the docker-router-compose.yml directly, i now can get the rhodecode dashboard up on port 10020 but the edge router displays this:

So here’s an example how to change default 80 port to 85

## docker network create -d overlay lb-net
services:

  traefik:
    restart: always
    image: traefik:v2.10.7

    ports:
      # Default ports on Edge router.
      # Format is HOST:CONTAINER
      # To modify the HOST ports only change the first parts before colon.
      #
      # The HTTP port, exposed as http entrypoint
      - "80:80"
      # The HTTPS port, exposed as https entrypoint
      - "443:443"
      # The loki port, exposed as loki entrypoint behind auth
      - "3100:3100"
      # The SSH port exposed as sshd entrypoint, default 9022
      - "${RC_SSH_PORT:-9022}:${RC_SSH_PORT:-9022}"

unfortunetly this can’t be done via an override yaml config at the moment. So the main edge router yaml file needs a modification.

Hi !

Thanks for suggesting this, we found a nice way to override the ports via the custom overrides files, please check:

https://docs.rhodecode.com/rcstack/configuration/custom-traefik-ports.html

Hi, thanks for this new override method. But even if i override the traefik ports, the edge router keeps reporting that the backend isn’t online. I opened up a direct port in docker to the rhodecode dashboard on 10020 which I’ve been using for the past week and that works fine, I’m just still confused why the edge router itself flat out doesnt work

Can you show us the output from

./rcstack status --detailed --configs

This is the output:

root@monarch5:/opt/docker-rhodecode# ./rcstack status --detailed --configs
Running hostname: http://code.luxploit.net
rcstack:
  config (in-host): /opt/docker-rhodecode/.custom/.runtime.env
RhodeCode:
  ini (in-host): config/_shared/rhodecode.ini
  volumes (in-container):
    repo-store: /var/opt/rhodecode_repo_store
    data-store: /var/opt/rhodecode_data
VCSServer:
  ini (in-host): config/_shared/vcsserver.ini
  volumes (in-container):
    repo-store: /var/opt/rhodecode_repo_store
    data-store: /var/opt/rhodecode_data
Traefik (router):
  ssl-certs definitions: .custom/traefik_custom/dynamic/traefik_dynamic_custom.yaml
  ssl-certs dir:         .custom/traefik_custom/dynamic/certs/
CONTAINER:      rc_cluster_apps-rhodecode-1
LOGS:           docker logs --tail=100 f2742725fc74
ID:             f2742725fc74
IMAGE:          rhodecode/rhodecode-ce:beta
STATUS:         Up 3 days (healthy)
PORTS:          0.0.0.0:10020->10020/tcp, :::10020->10020/tcp


CONTAINER:      rc_cluster_apps-sshd-1
LOGS:           docker logs --tail=100 c8327fbd18fe
ID:             c8327fbd18fe
IMAGE:          rhodecode/rhodecode-ce:beta
STATUS:         Up 3 days (healthy)
PORTS:


CONTAINER:      rc_cluster_apps-celery-1
LOGS:           docker logs --tail=100 0512a6c25c82
ID:             0512a6c25c82
IMAGE:          rhodecode/rhodecode-ce:beta
STATUS:         Up 3 days
PORTS:


CONTAINER:      rc_cluster_apps-vcsserver-1
LOGS:           docker logs --tail=100 92d7ca69bfd5
ID:             92d7ca69bfd5
IMAGE:          rhodecode/rhodecode-ce:beta
STATUS:         Up 3 days (healthy)
PORTS:


CONTAINER:      rc_cluster_apps-celery-beat-1
LOGS:           docker logs --tail=100 b168aa3321ec
ID:             b168aa3321ec
IMAGE:          rhodecode/rhodecode-ce:beta
STATUS:         Up 3 days
PORTS:


CONTAINER:      rc_cluster_apps-svn-1
LOGS:           docker logs --tail=100 c9e0e7120cf9
ID:             c9e0e7120cf9
IMAGE:          rhodecode/rhodecode-ce:beta
STATUS:         Up 3 days (healthy)
PORTS:


CONTAINER:      rc_cluster_services-elasticsearch-1
LOGS:           docker logs --tail=100 a790dd41dbb4
ID:             a790dd41dbb4
IMAGE:          elasticsearch:6.8.23
STATUS:         Up 3 days (healthy)
PORTS:          9200/tcp, 9300/tcp


CONTAINER:      rc_cluster_services-redis-1
LOGS:           docker logs --tail=100 dd6edb4229d7
ID:             dd6edb4229d7
IMAGE:          redis:7.2.4
STATUS:         Up 3 days (healthy)
PORTS:          6379/tcp


CONTAINER:      rc_cluster_services-nginx-errors-1
LOGS:           docker logs --tail=100 3282db44968d
ID:             3282db44968d
IMAGE:          nginx:1.25.3
STATUS:         Up 3 days
PORTS:          80/tcp


CONTAINER:      rc_cluster_services-nginx-statics-1
LOGS:           docker logs --tail=100 e41b1bf171ae
ID:             e41b1bf171ae
IMAGE:          nginx:1.25.3
STATUS:         Up 3 days (healthy)
PORTS:          80/tcp


CONTAINER:      rc_cluster_services-database-1
LOGS:           docker logs --tail=100 25f2606f8bfa
ID:             25f2606f8bfa
IMAGE:          postgres:14.10
STATUS:         Up 3 days (healthy)
PORTS:          5432/tcp


CONTAINER:      rc_cluster_services-channelstream-1
LOGS:           docker logs --tail=100 921e2e2c2092
ID:             921e2e2c2092
IMAGE:          channelstream/channelstream:0.7.1
STATUS:         Up 3 days (healthy)
PORTS:          8000/tcp


CONTAINER:      rc_cluster_metrics-node-exporter-1
LOGS:           docker logs --tail=100 3c88e6d3703c
ID:             3c88e6d3703c
IMAGE:          prom/node-exporter:v1.7.0
STATUS:         Up 3 days
PORTS:          9100/tcp


CONTAINER:      rc_cluster_metrics-promtail-1
LOGS:           docker logs --tail=100 efb9ba401a29
ID:             efb9ba401a29
IMAGE:          grafana/promtail:2.9.3
STATUS:         Up 3 days
PORTS:


CONTAINER:      rc_cluster_metrics-prometheus-1
LOGS:           docker logs --tail=100 414ec90829d0
ID:             414ec90829d0
IMAGE:          prom/prometheus:v2.48.1
STATUS:         Up 3 days
PORTS:          9090/tcp


CONTAINER:      rc_cluster_metrics-loki-1
LOGS:           docker logs --tail=100 3030ba78c978
ID:             3030ba78c978
IMAGE:          grafana/loki:2.9.3
STATUS:         Up 3 days
PORTS:          3100/tcp


CONTAINER:      rc_cluster_metrics-statsd-exporter-1
LOGS:           docker logs --tail=100 f7503ef462ba
ID:             f7503ef462ba
IMAGE:          prom/statsd-exporter:v0.26.0
STATUS:         Up 3 days (healthy)
PORTS:          9102/tcp, 9125/tcp, 9125/udp


CONTAINER:      rc_cluster_metrics-grafana-1
LOGS:           docker logs --tail=100 7d78c586d08e
ID:             7d78c586d08e
IMAGE:          grafana/grafana:9.5.15
STATUS:         Up 3 days
PORTS:          3000/tcp


CONTAINER:      rc_cluster_router-traefik-1
LOGS:           docker logs --tail=100 a293d2b08200
ID:             a293d2b08200
IMAGE:          traefik:v2.10.7
STATUS:         Up 3 days
PORTS:          0.0.0.0:3100->3100/tcp, :::3100->3100/tcp, 0.0.0.0:9022->9022/tcp, :::9022->9022/tcp, 0.0.0.0:8072->80/tcp, :::8072->80/tcp, 0.0.0.0:8073->443/tcp, :::8073->443/tcp

Maybe this is related to SSL ? Have you set use SSL in setup process or left it at no ssl ?

I have SSL disabled because I proxy rhodecode out through nginx and cloudflare which handle proxy-ing with SSL. Currently code.luxploit.net is pointing to the 10020 port (direct) rather then the 8072 port (traefik), as pointing it to Port 8072 will incur the traefik error, as seen in my second reply. Using the direct port it works but I’d still like to get the stack working as it should

the matching is on “hostname” sent to traefik, if this can’t be detected traefik wont match to running RhodeCode. Maybe cloudflare is not sending in proper hostname, or it’s sending https (while traefik expects http, which is interesting case…)

This could explain it as cloudflare will upgrade the connection automatically to HTTPS and nginx also listens for HTTPS. I could try setting the hostname to https and seeing if that makes a difference in traefik

Nope! Traefik is still reporting that the rhodecode backend is offline, even after changing the hostname to https

root@monarch5:/opt/docker-rhodecode# ./rcstack status -v --configs
Running hostname: https://code.luxploit.net
....

how did you change the hostname to https ?

i edited the .custom/.runtime.env file